

Programmers need to deal with lots of diagrams in their daily life: flowcharts, architecture diagrams, interaction diagrams, functional module diagrams, UML class diagrams, deployment diagrams, various visual diagrams, and so on.
Through the form of diagrams, one can better display the system, more clearly express their ideas, easy to understand; also can exercise their own drawing skills, really a multi-benefit thing.

Today I will share my common diagramming software and a little tips.
Commonly used diagrams
I usually draw more flowcharts, interaction diagrams and architecture diagrams, and I usually use Draw.io, a free online web drawing tool, to get it done.
The main reasons why I chose this drawing tool are as follows.
1. ease of use
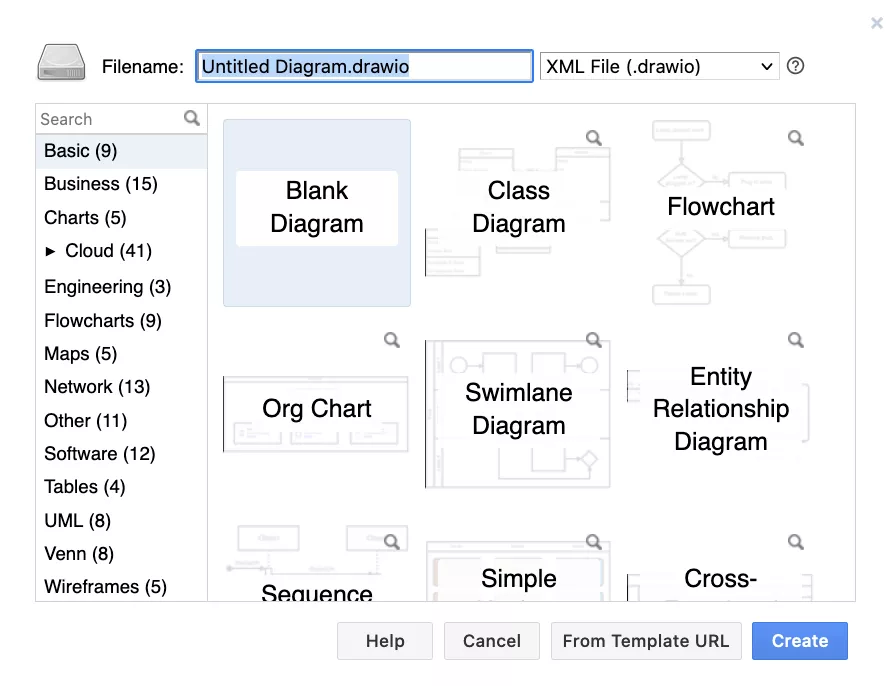
No need to log in, directly access the web page, you can directly use a large number of templates to create new projects.
Select a template
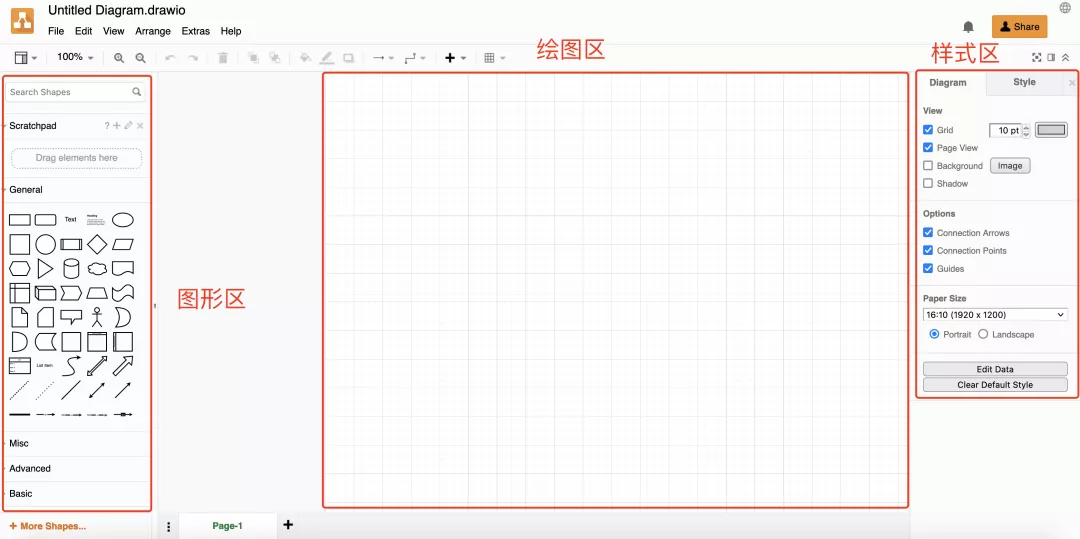
Then enter the editing page, select the graphics you need on the left, drag them to the drawing area for editing, and then modify the style on the right.
Draw.io online drawing
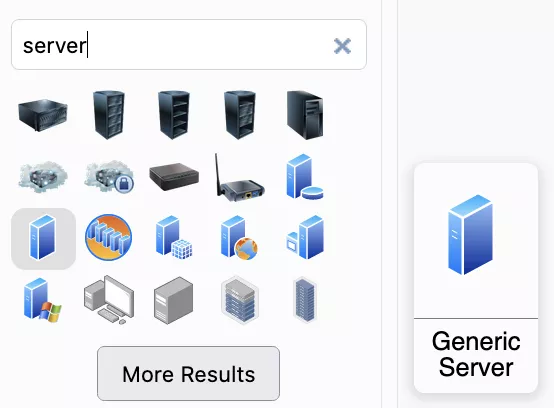
You can directly search for the needed graphics, such as the server, and of course, you can also directly paste local or network images.
2. Beautiful style
Draw.io provides several default themes and preset graphic styles, such as my favorite hand-drawn style.
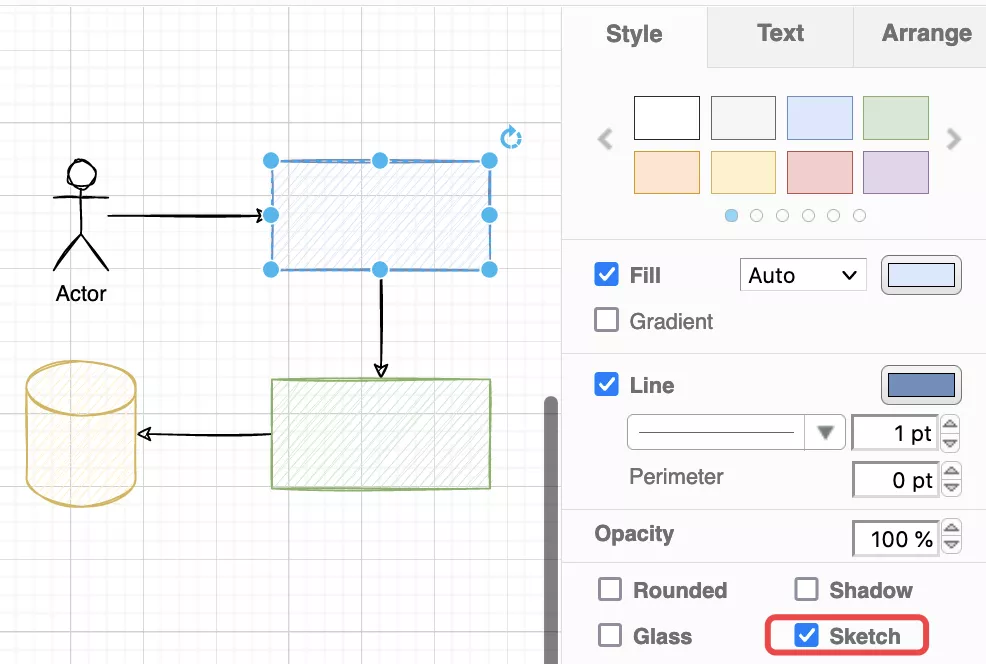
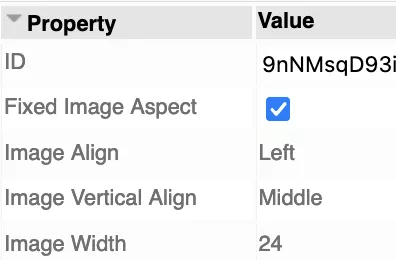
Of course, you can also customize the graphics with a high degree of flexibility, and if you are familiar with interface development, you can even edit the values of the graphics properties directly.
Property editing
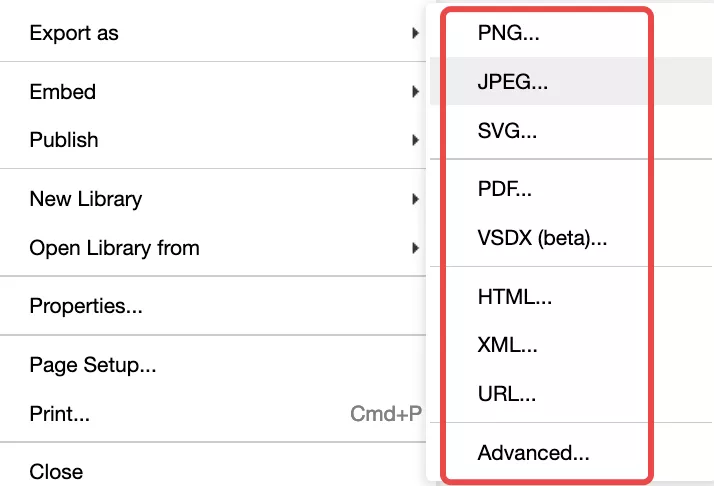
3. Rich Export
You can export the drawing to image, vector, PDF, HTML document, etc. with one click.
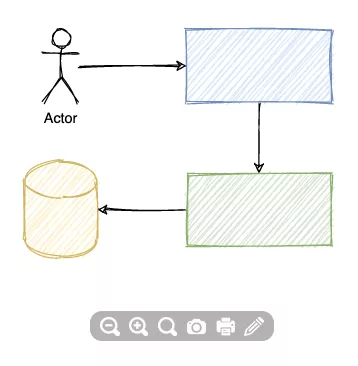
What I like most is that it can generate online web pages directly and share them with others for quick browsing, and it also provides a small toolbar for zooming, screenshotting, printing and quick editing.
Online Browsing
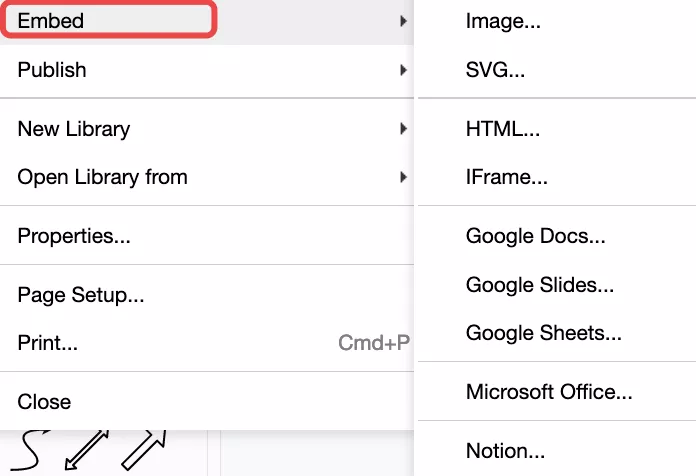
In addition, you can export your drawings as embedded web pages! This allows us to seamlessly integrate all kinds of drawings directly into the web pages we develop.
Export to embedded format
4. Easy storage and import
You can save your drawing as a local file at any time, or store it in an online space like GitHub; when you need to edit it again, you can import it from the same place.
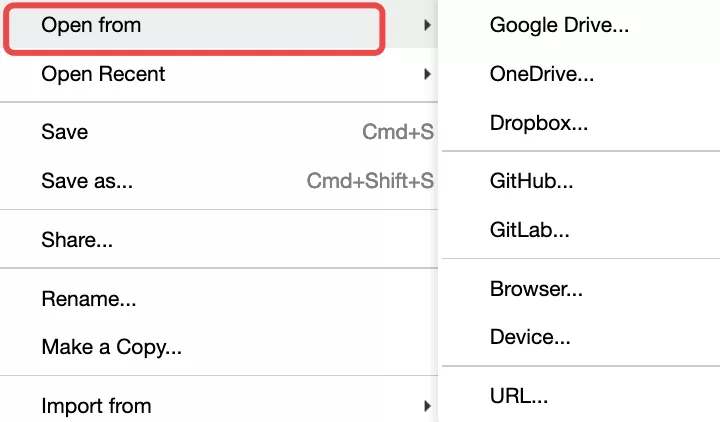
For those of you who are used to using GitHub to store and share your code, this is very useful and means you can collaborate on drawings with other students.
In addition to Draw.io, I also like EdrawMax, a local mapping software that is also very powerful.
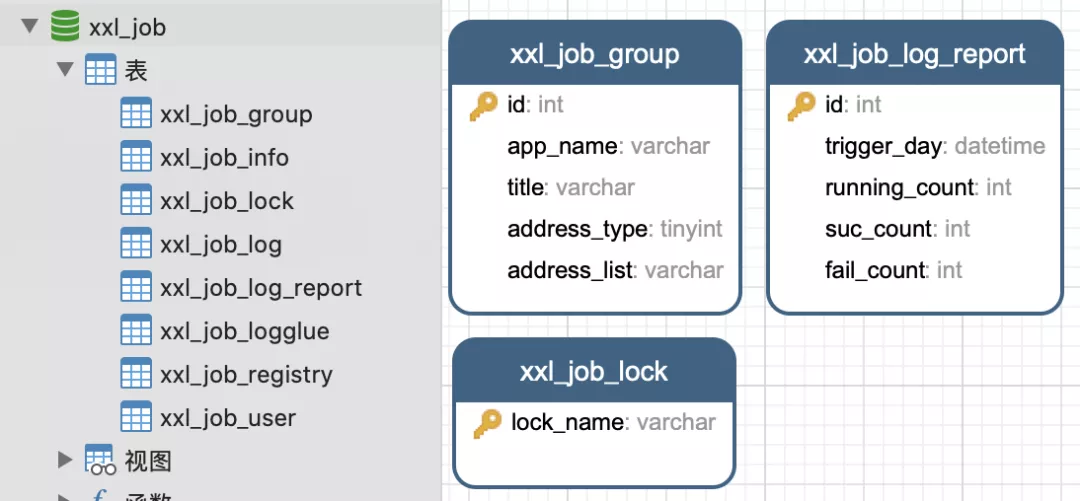
ER Diagram
Backend development students may come across ER diagrams, which are often used in database design to represent the properties and relationships of data.
I usually don’t draw this stuff manually, I just use database management software (such as Navicat, JetBrains DataGrip, etc.) to generate it based on the existing library tables when needed.
Automatic generation of ER diagrams
UML Class Diagram
UML class diagrams are used to represent the relationship between classes and help to quickly understand the design structure of the whole system.
Like ER diagrams, I don’t draw this stuff myself, it’s exhausting. Generally, I use an IDE (such as JetBrains IDEA) to automatically generate UML class diagrams based on the code, as shown in the figure.
Automatic generation of UML class diagrams
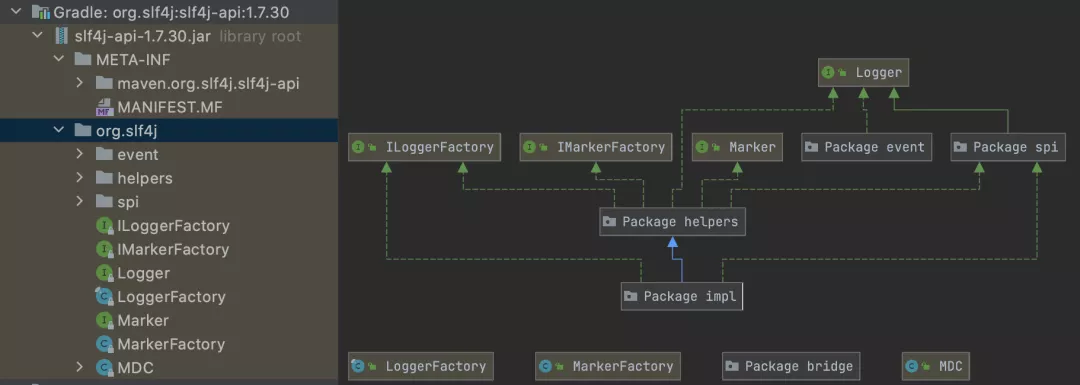
This is not better than drawing your own?
Visual diagram
Charts can show data and trends more visually, and play a pivotal role in PPT presentations.
Common charts include bar charts, column charts, pie charts, line charts, and so on.
Although Excel and PPT can draw charts, they are relatively ugly, so I recommend Flourish, a website that generates visual charts online.
It has a rich set of built-in templates for chart types.
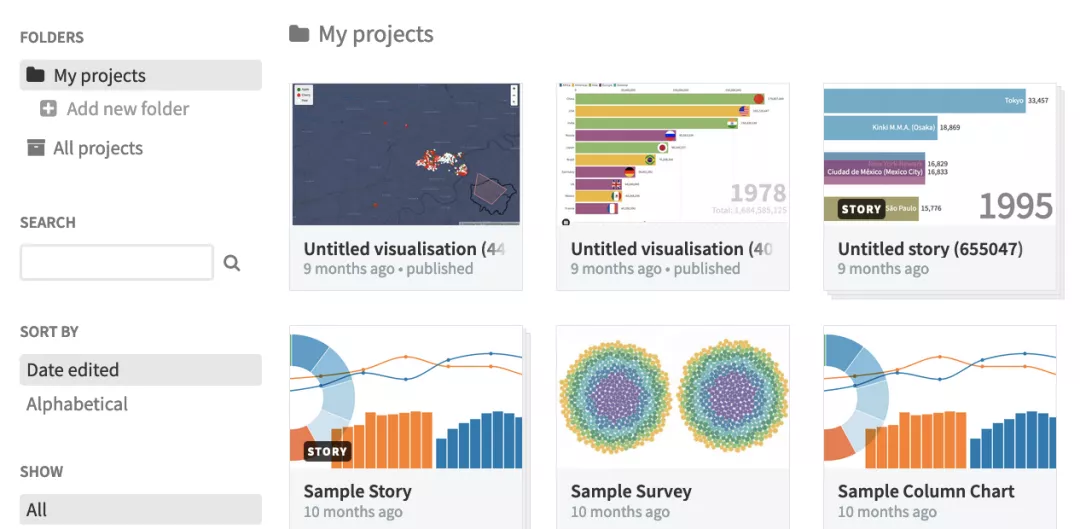
After selecting a chart type, you can configure the data to be displayed and the chart style.
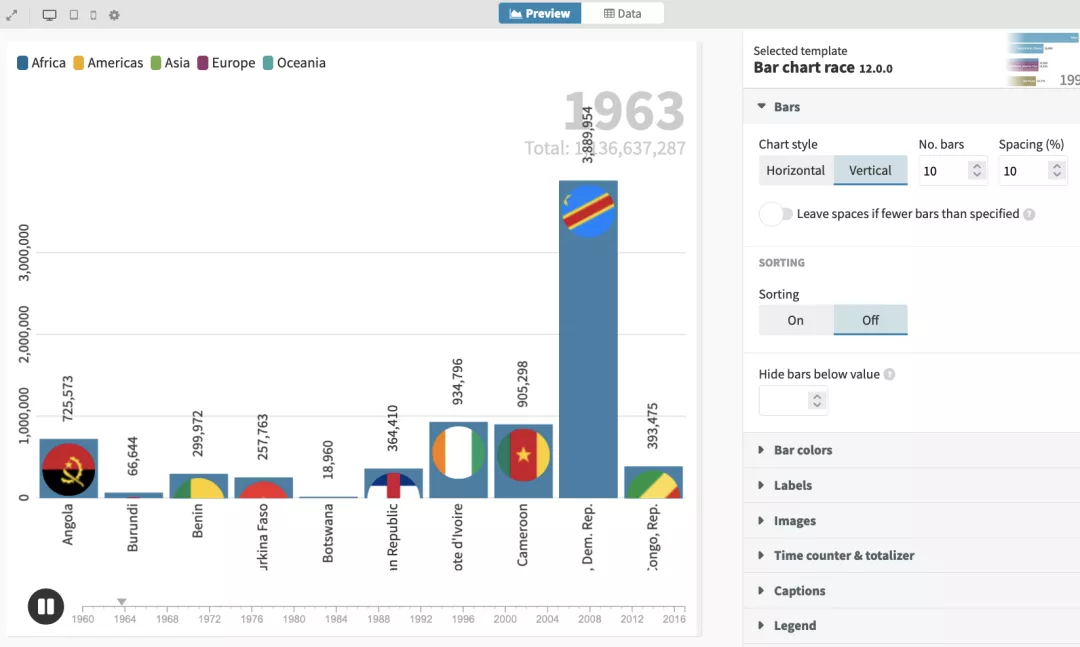
I like the dynamic charts and URL sharing feature that allows you to quickly create real-time charts with dynamically changing values.
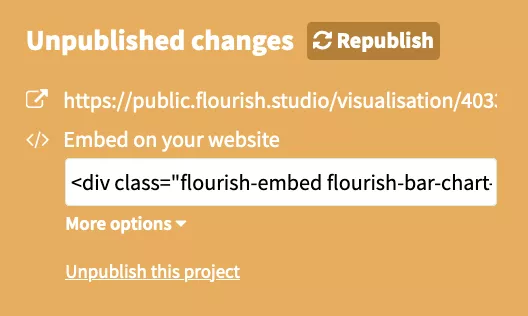
Once you’re done, you can share the web address with a single click for others to view or embed in your own web page.
Export chart pages
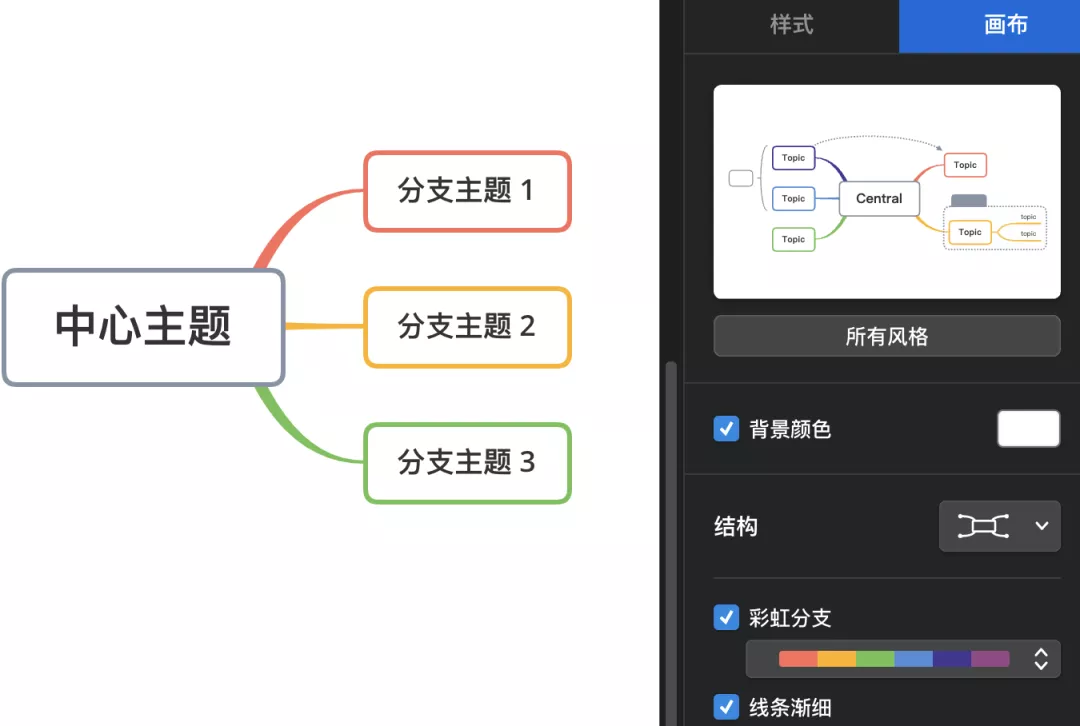
Mind Map
The most common mind mapping software I use is XMind, which is easy to use and rich in topics.
XMind
I usually don’t write mind maps directly in XMind, but I write a Markdown document first, and then import the document directly into XMind to automatically generate mind maps based on headings, lists, and other elements.
Importing Markdown
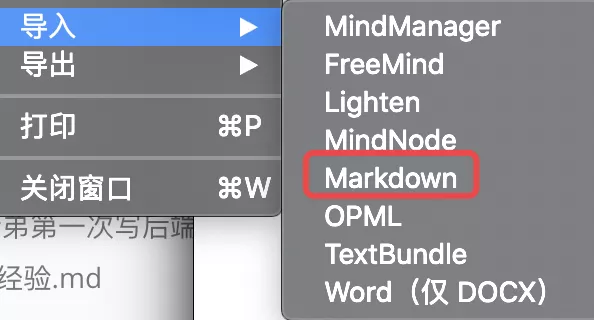
Otherwise, it would be really tiring to edit them one by one.
Postscript
Drawing diagrams is something that can be imitated, more reading and more drawing, practice makes perfect.
When you need to draw a diagram, if you can’t draw, no ideas, just go online and search for similar diagrams drawn by others, and just draw a tiger from a cat.