
We’d like to introduce you to an awesome spatial (geographic) data visualization tool: keplergl.
Keplergl is completely open source by Uber and is the default tool for spatial data visualization within Uber.
Through its open interface package keplergl for Python, we can pass in a variety of formats of data by writing Python code in jupyter notebook, and use its built-in rich spatial data visualization functions in its interactive window embedded in notebook. Here are 3 main addresses for learning.
-
the official website address: https://kepler.gl/
-
jupyter notebook manual address: https://github.com/keplergl/kepler.gl/tree/master/docs/keplergl-jupyter#geojson
-
Case study address: https://github.com/keplergl/kepler.gl/tree/master/bindings/kepler.gl-jupyter/notebooks
Installation
The installation of keplergl is very simple.
pip install keplergl
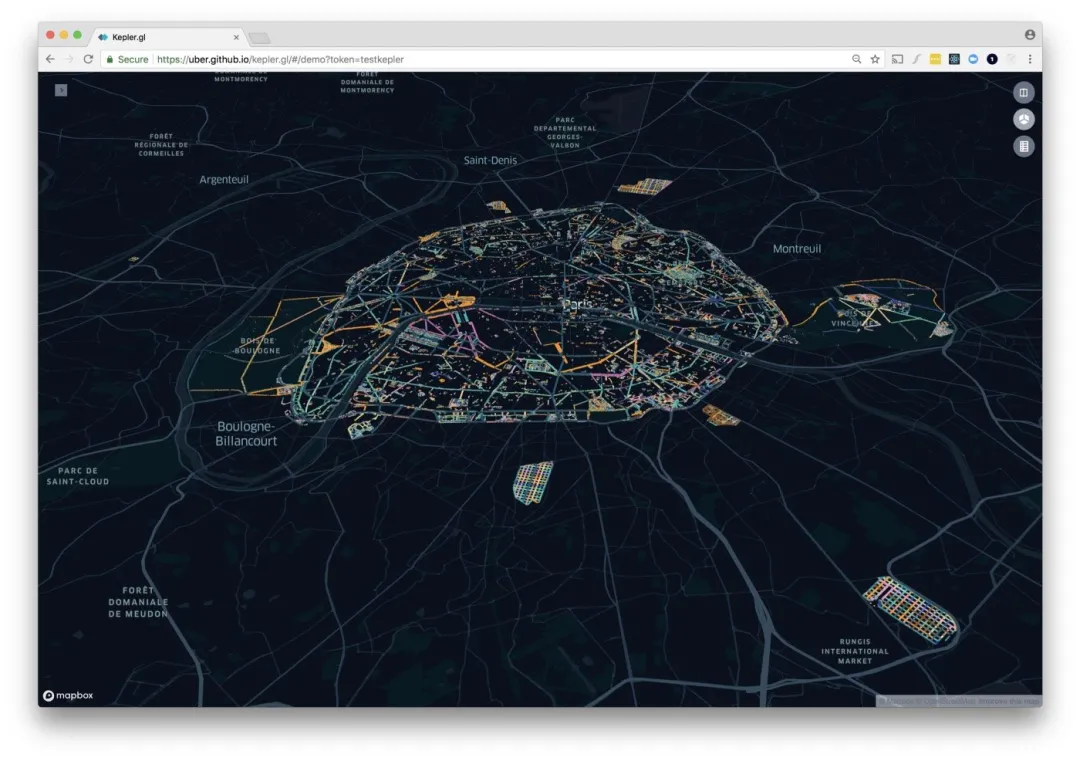
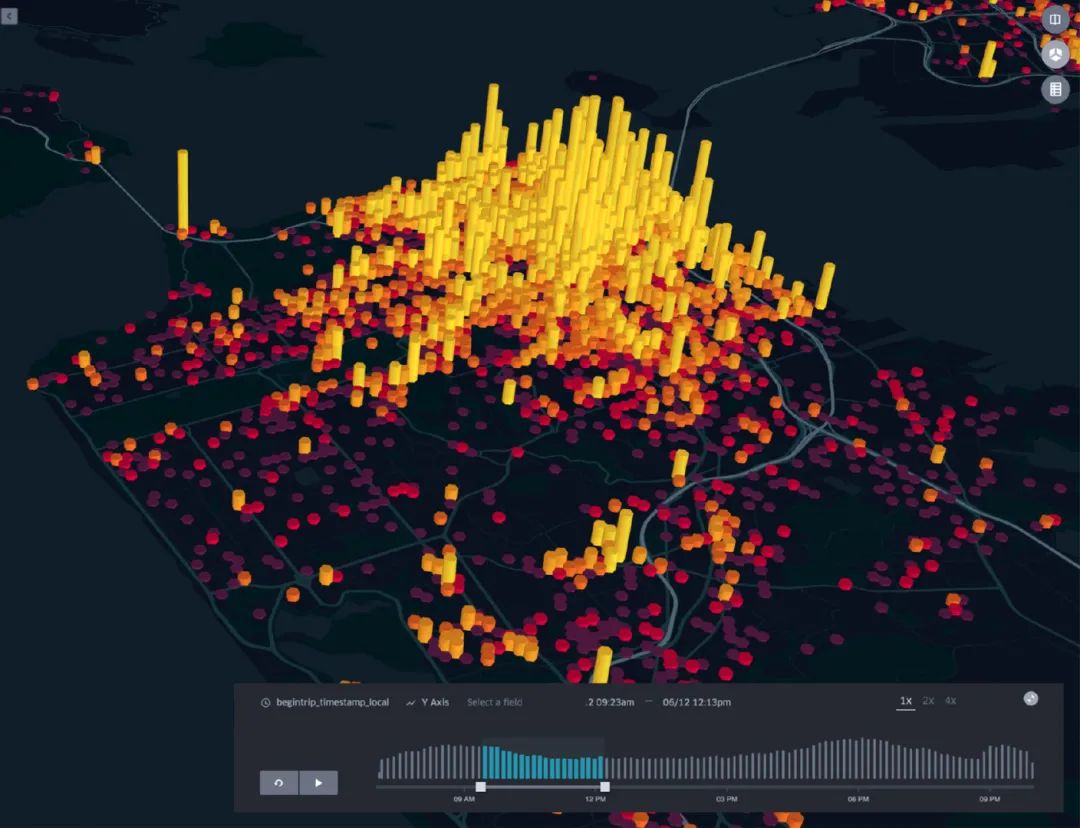
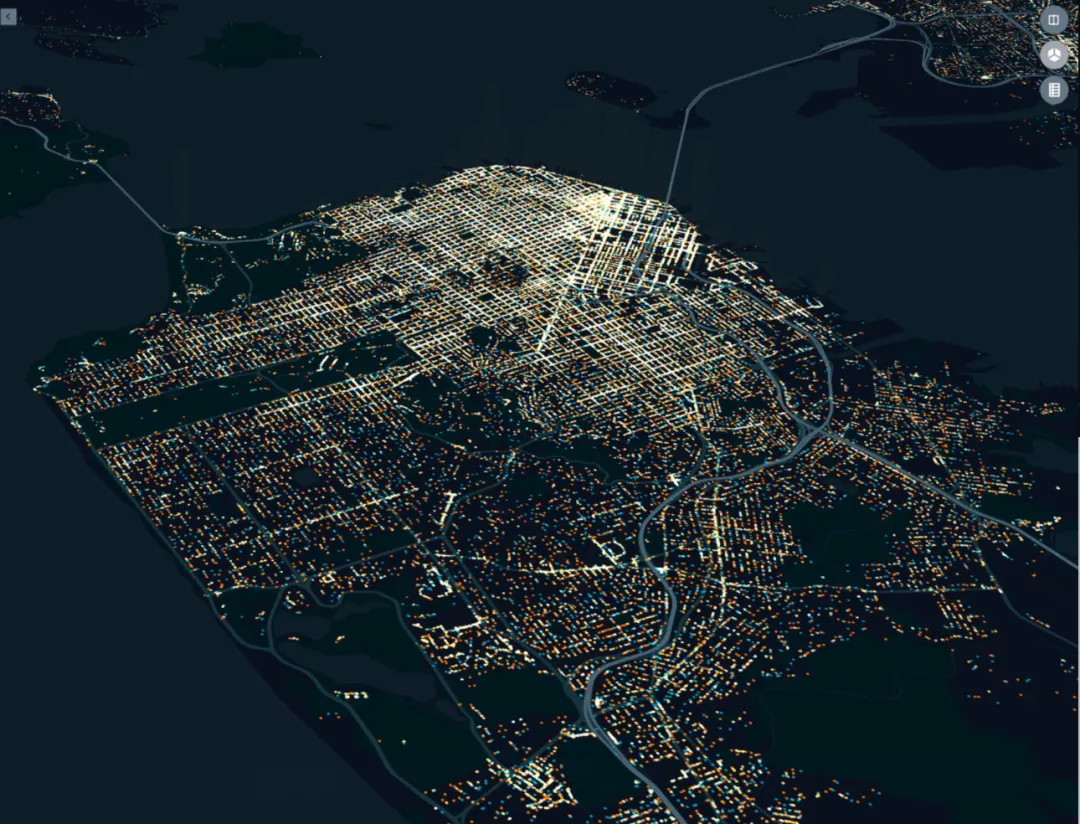
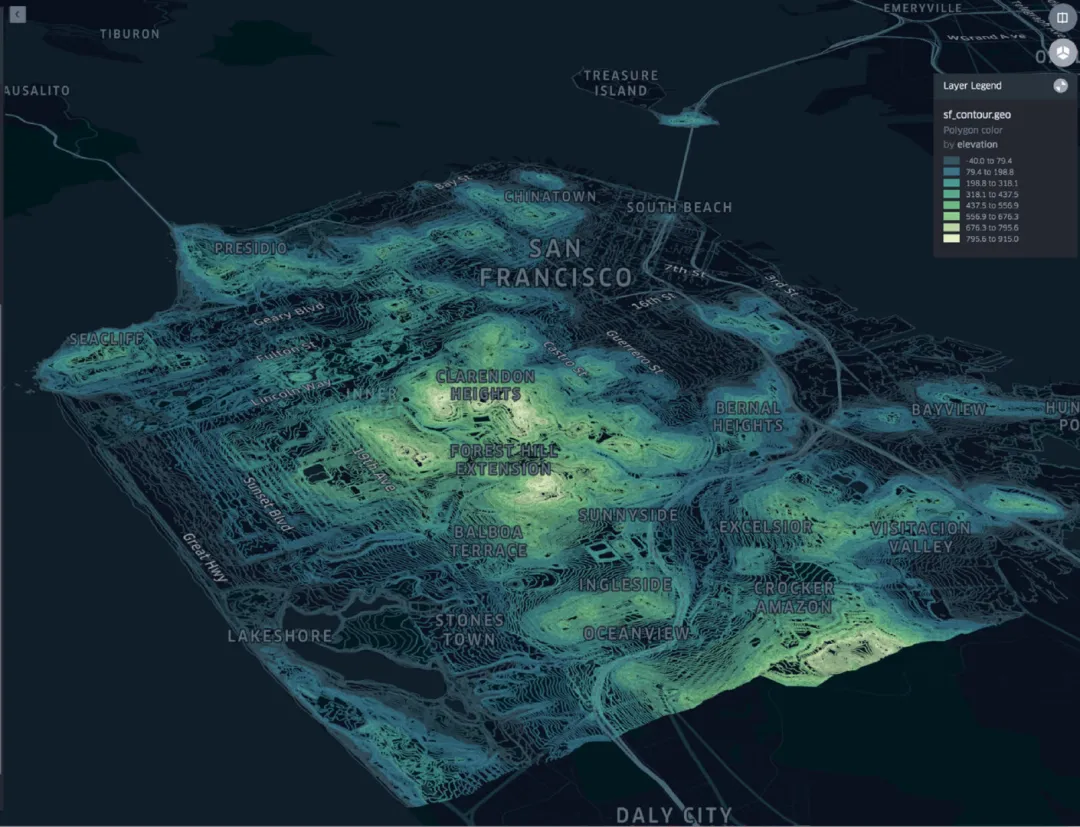
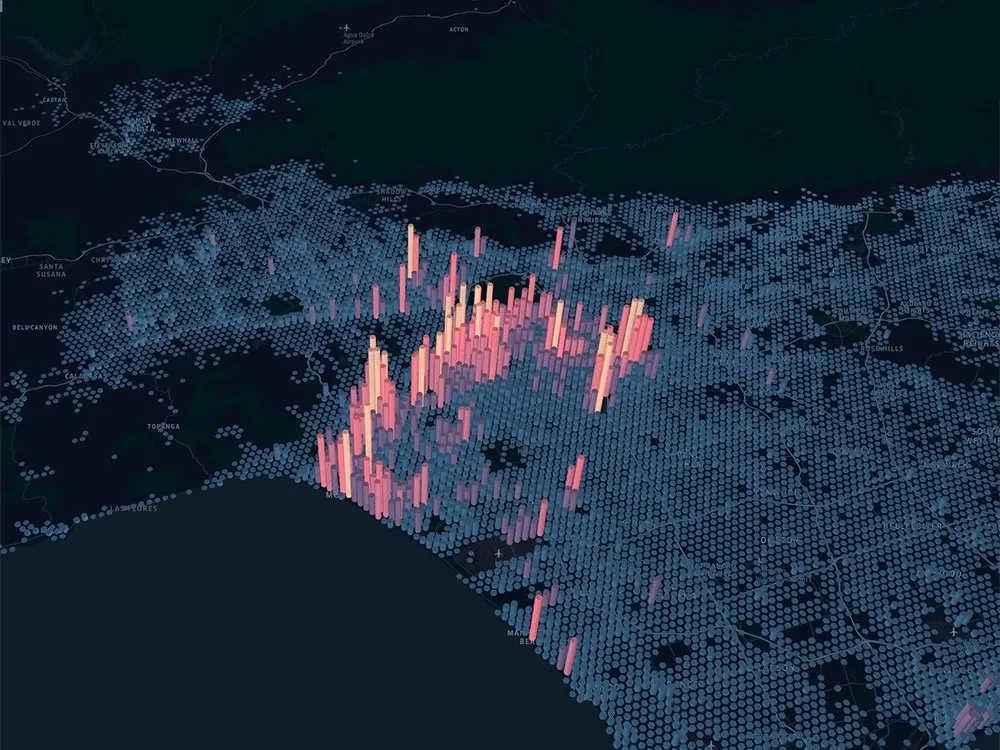
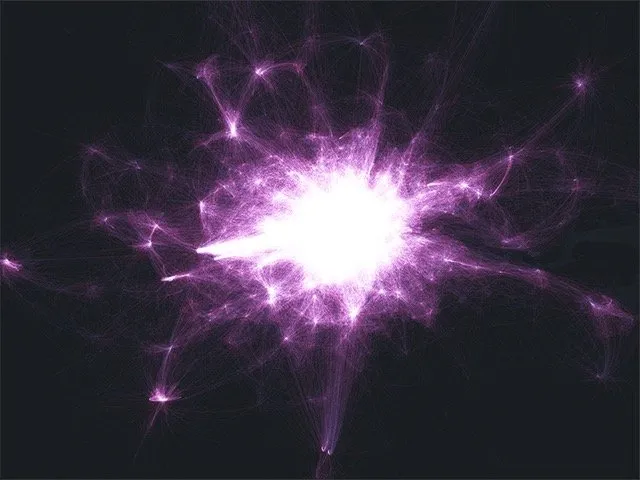
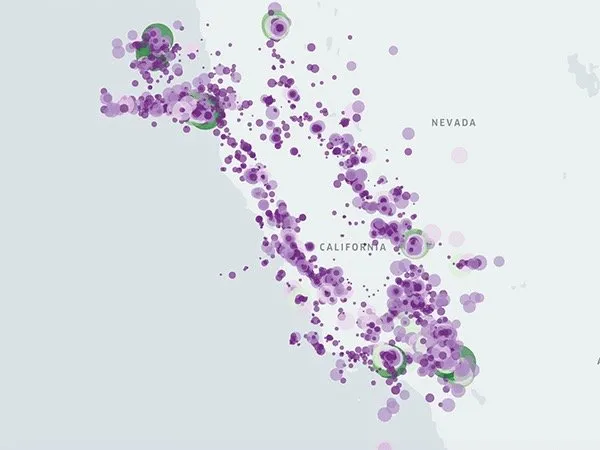
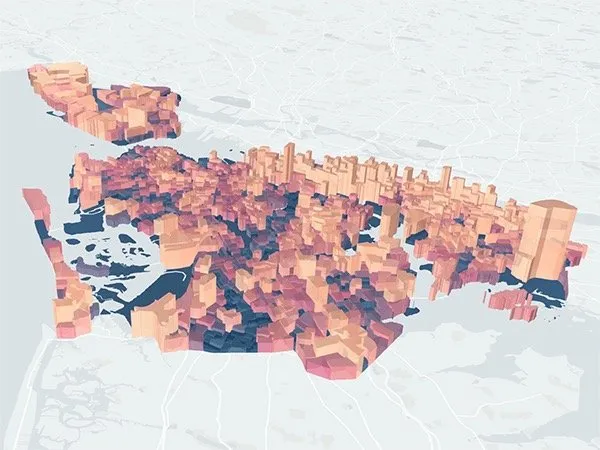
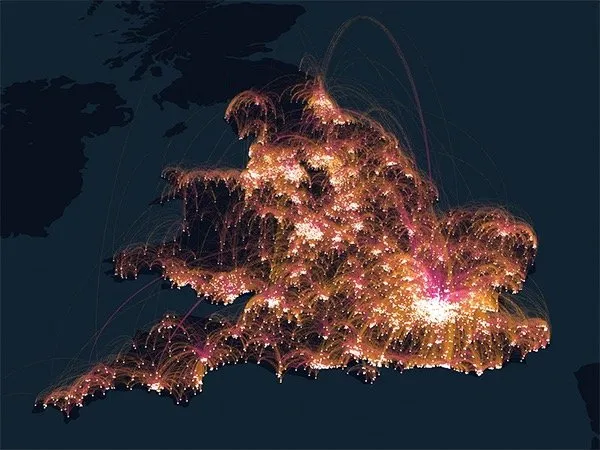
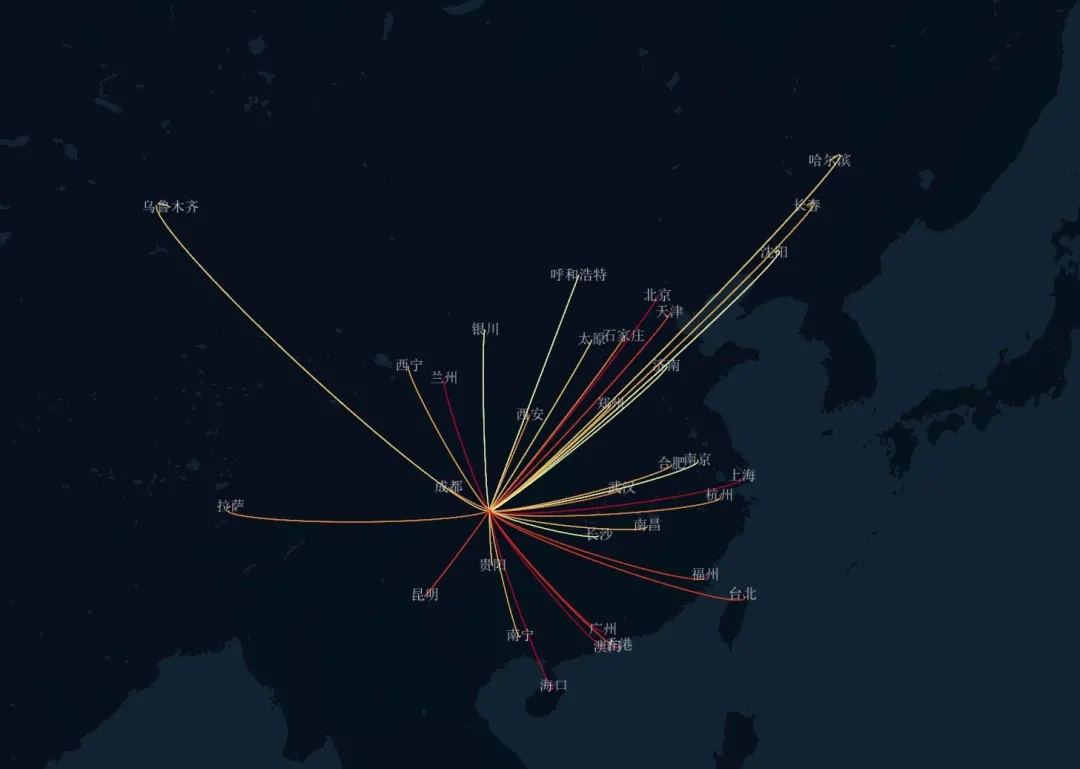
Amazing graphics
A wave of stunning graphics are coming.
Getting Started
import pandas as pd
import geopandas as gpd

from keplergl import KeplerGl

# Create an object
kep1 = KeplerGl(height=600)
# Activate the object and load it into jupyter notebook
kep1
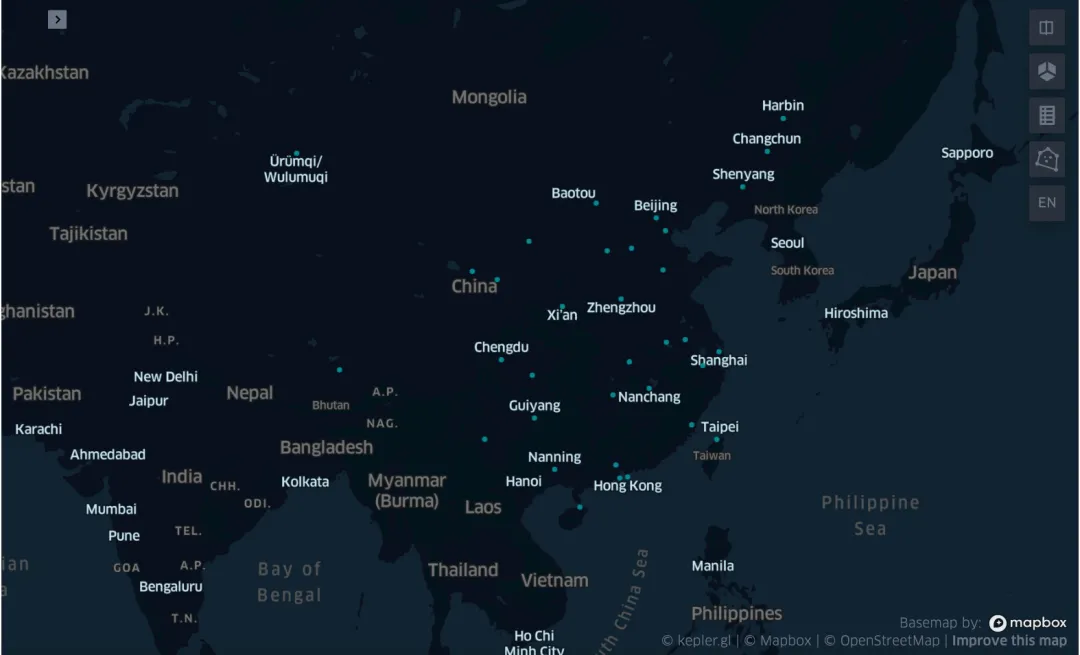
As you can see, after running the basic code in Jupyter directly generated the built-in graphics, the graphics themselves are also dynamic; dark black background is also my favorite:
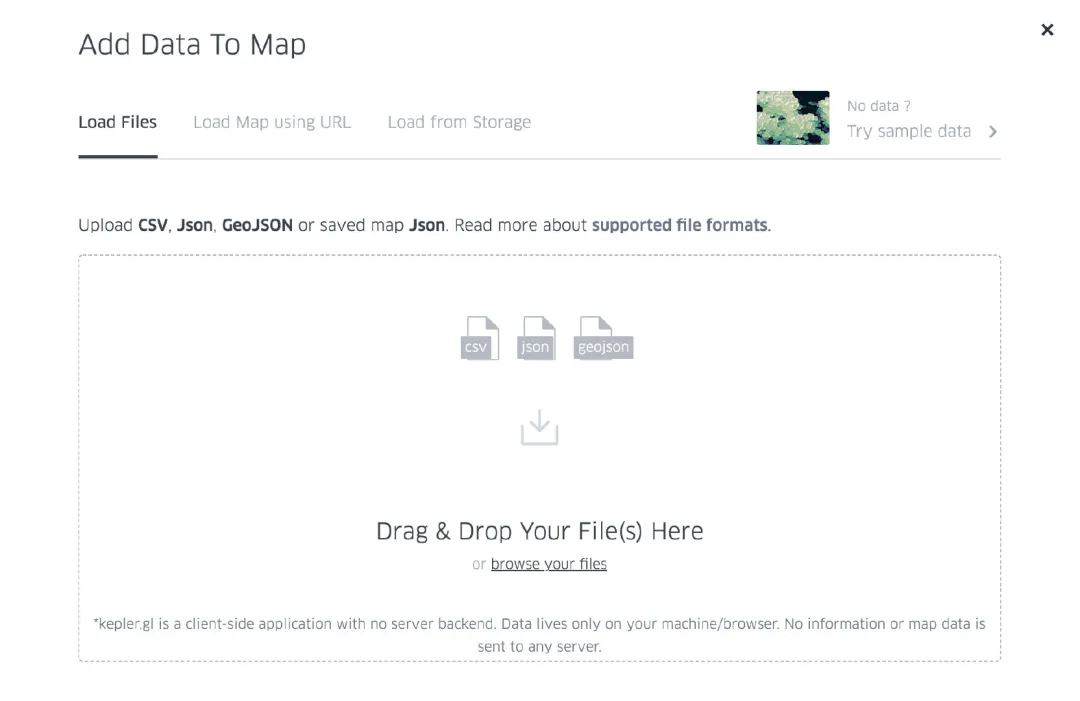
Adding data
By default, keplergl can add 3 types of data:
- csv
- GeoJSON
- DataFrame
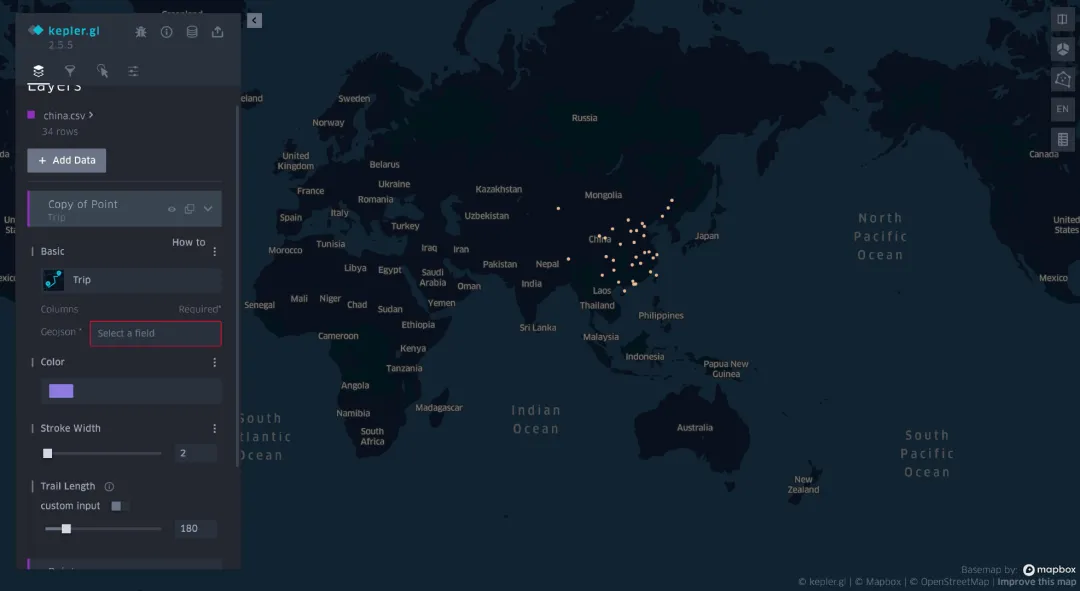
csv format
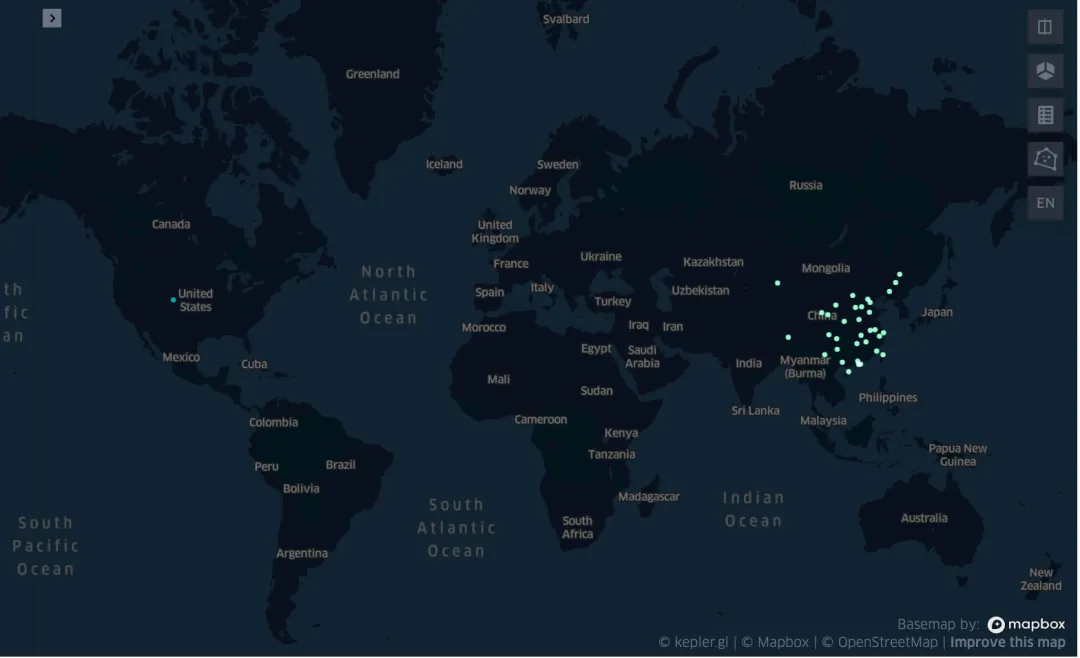
There is a csv data in the local directory: china.csv, which records the latitude and longitude of each province in China.
with open("china.csv", "r") as f:
    csv_data = f.read()

# add_data add data
kep1.add_data(data=csv_data, name="csv_kep")
kep1
DataFrame format
china = pd.read_csv("china.csv")
kep1.add_data(data=china, name="dataframe_kep")
kep1
GeoJson format
url = 'http://eric.clst.org/assets/wiki/uploads/Stuff/gz_2010_us_040_00_500k.json'
country_gdf = gpd.read_file(url) # geopandas read json file

kep1.add_data(data=country_gdf, name="state")
kep1
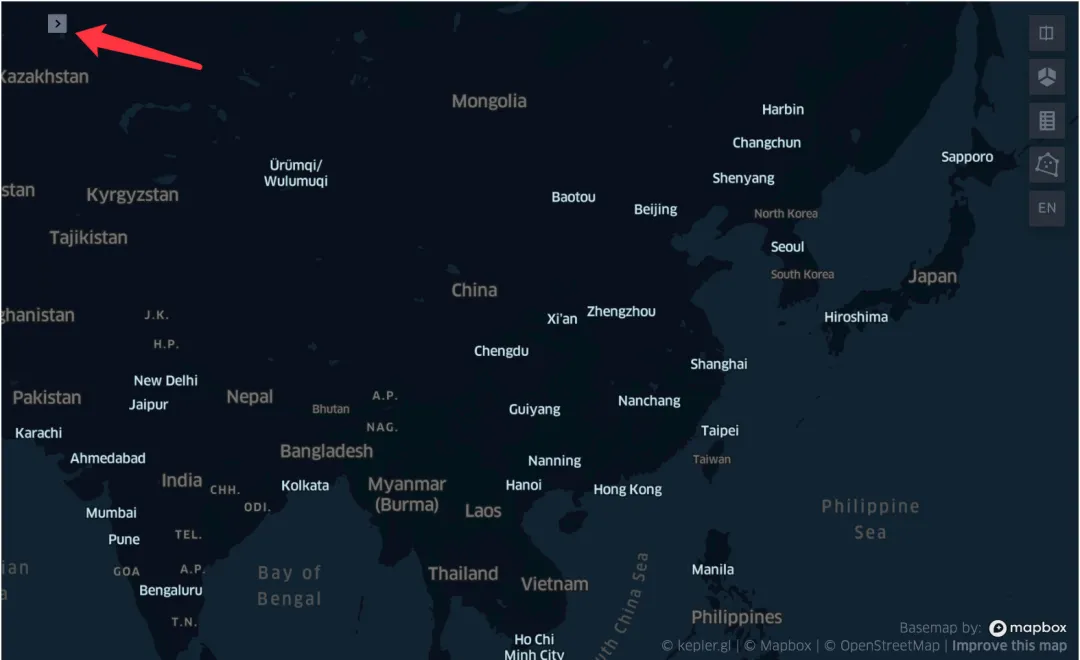
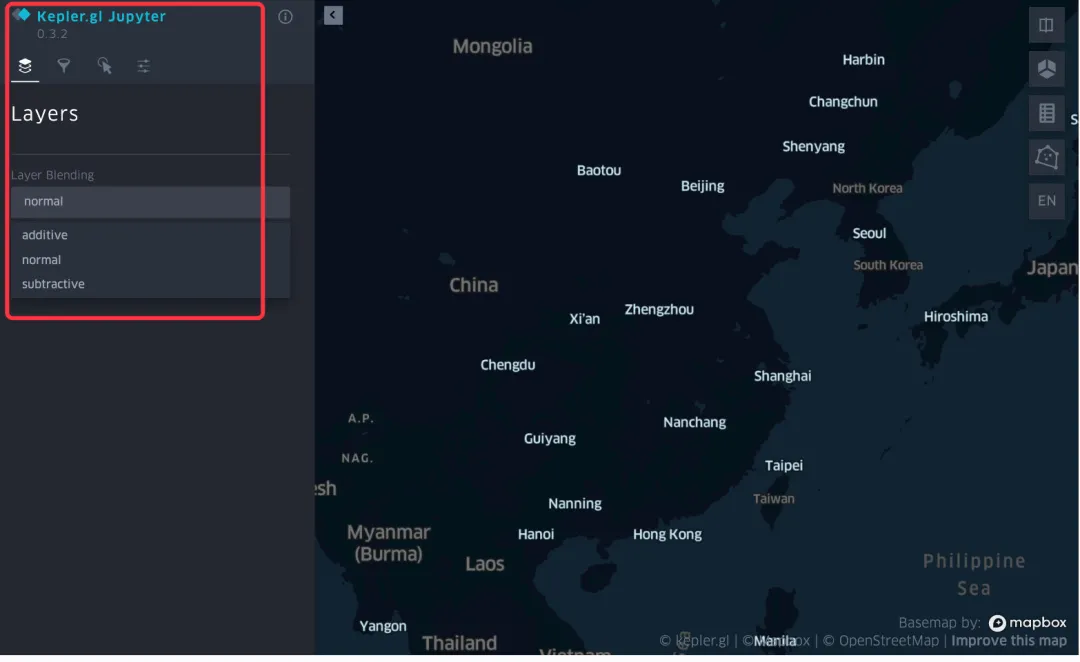
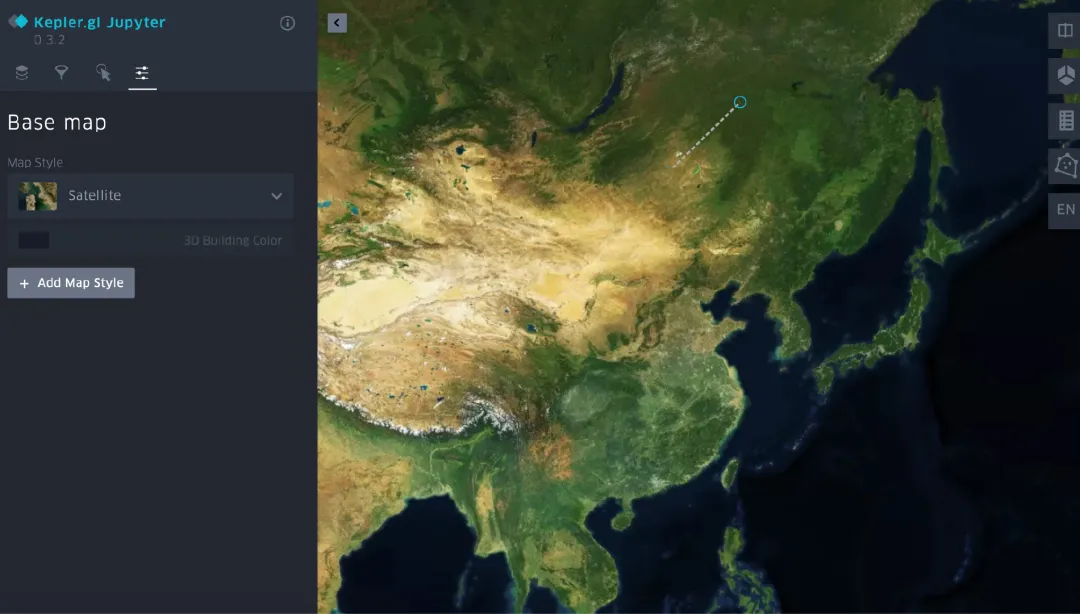
Custom graphics
Keplergl’s customization method: the criticality button. Once inside, you can customize the operation
Saving and reusing configurations
The configuration of the instantiated kep can be saved and reused in the following instance objects.
- Save.
# Save as a file
with open('config1.py','w') as f:
    f.write('config={}'.format(kep1.config))

# Run: magic command %run
%run config1.py
- Reuse
kep2 = KeplerGl(height=400,
                data={"layer1":df},
                config=kep1.config # configuration of kep1
               )
kep2
Save graphics
- minimalist version, mainly the file name
kep1.save_to_html(file_name="first_kep.html")
- full version: file name, configuration, data, readability
# 4 parameters
kep1.save_to_html(file_name="first_kep.html",
                  data={'data_1':china},
                  config=config,
                  read_only=True
                 )
Web app
The operations shown above are all done in the notebook, we can also do them directly online: https://kepler.gl/demo
We will share more articles after we have studied this tool seriously, this library is worth studying